
Opening and Saving maps
Returning to previous maps
There is a list of the maps you have previously accessed in the dropdown that is shown when you click on the small downward arrow on the right of the map title. To return to one of these previous maps, click on the item in the menu.
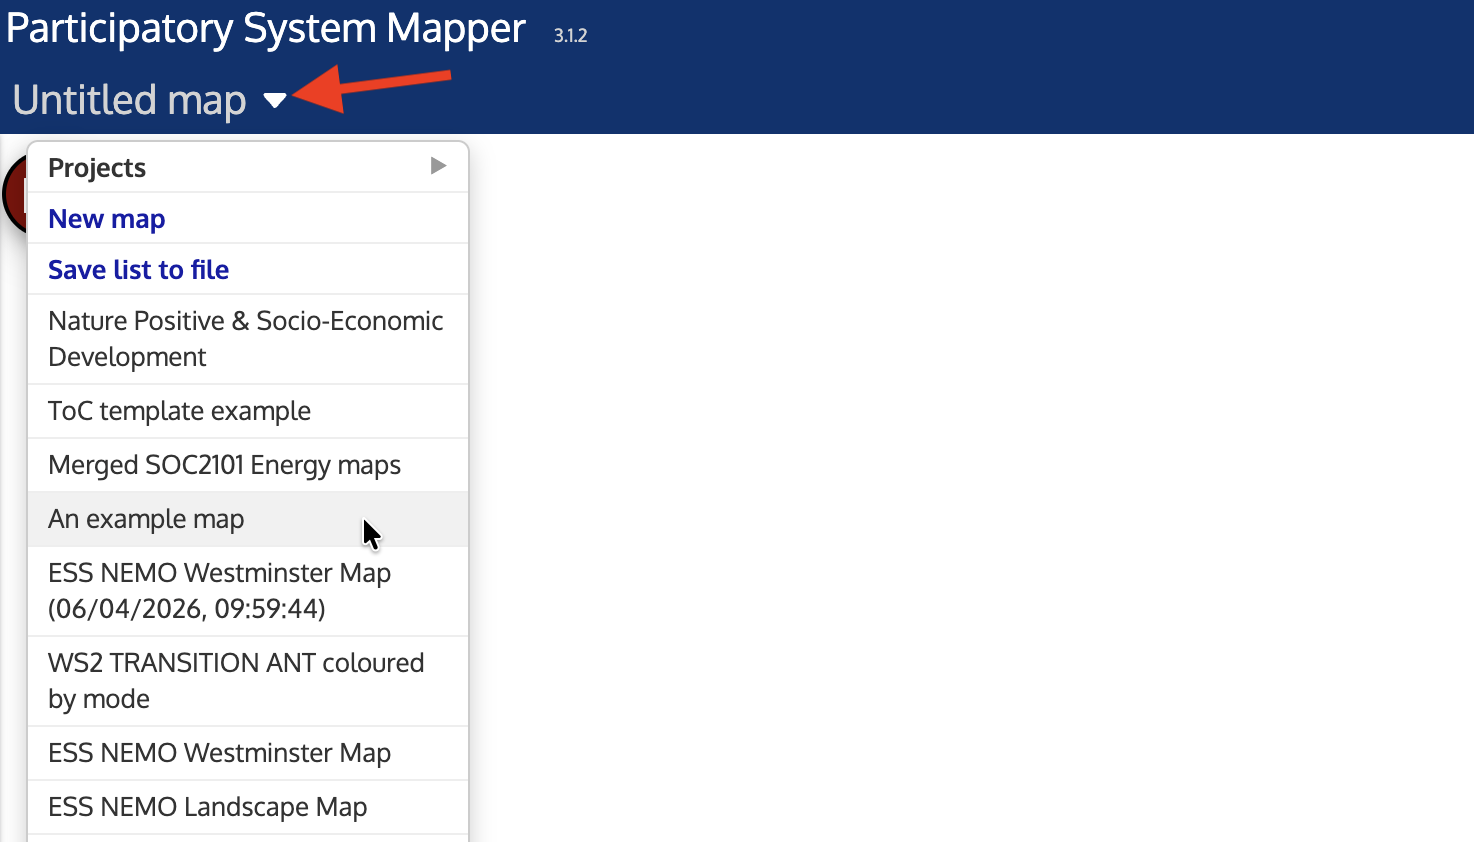
The items are in reverse time order - the last map you viewed is at the top of the list. If two maps in different rooms have the same title, the newer map is shown with the date and time it was created (See 'ESS NEMO Westminster Map (06/04/2026, 09:59:44)' in the image above as an example). The list scrolls up and down if you have too many recently visited maps to fit the window.
Clicking the 'New map' item will give you a blank map. Clicking 'Save list to file' will save the list to your local disk. If you need to reload it later, just drag the file onto the map window. The list of maps in the file will be merged with any existing list.
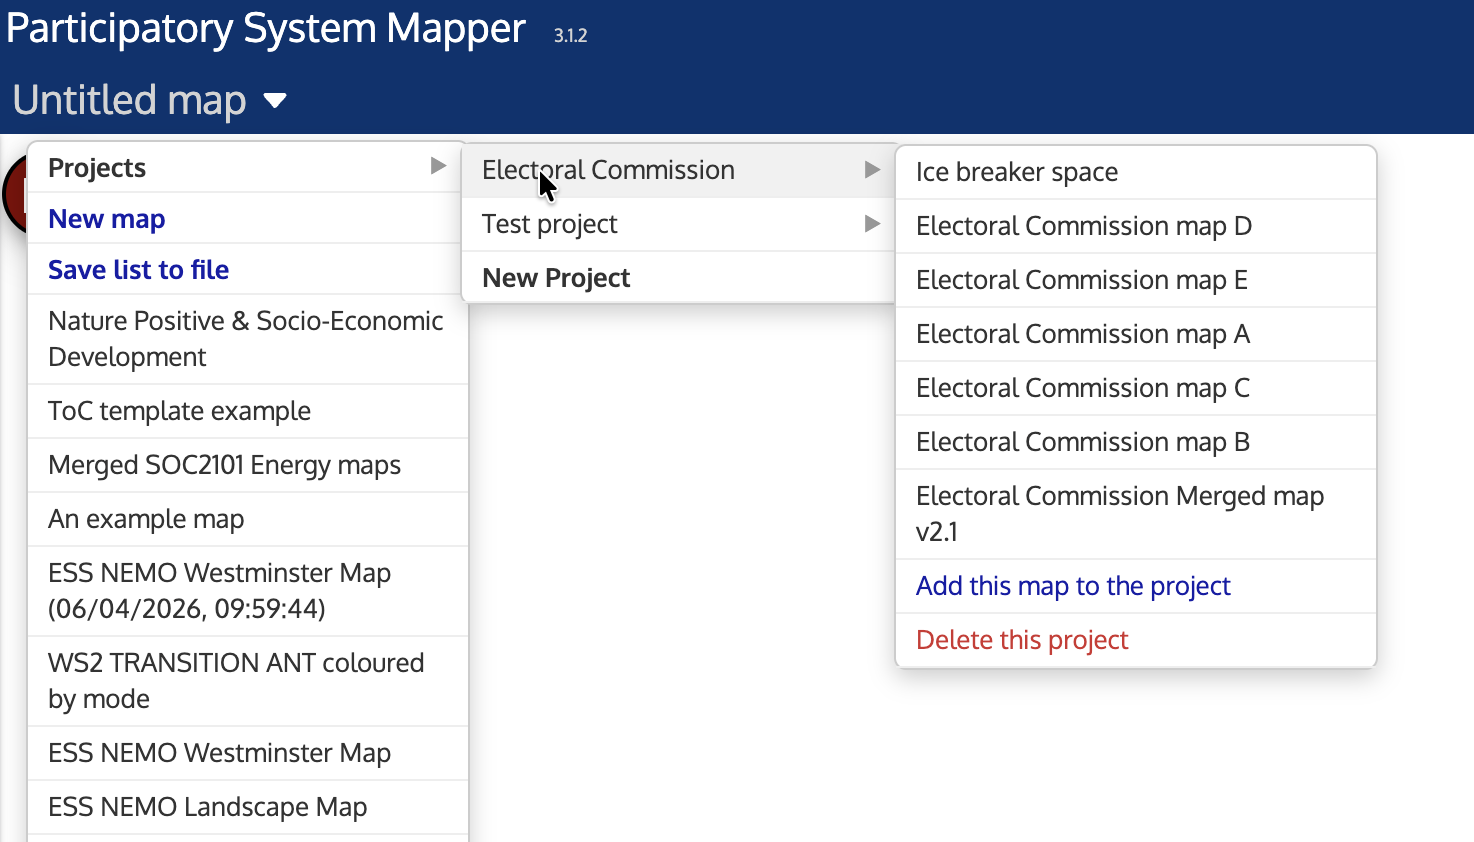
Often, you will have a set of maps created for a particular project. It is convenient to have a list of these easily to hand. If you slide the mouse to the right over the 'Projects' item, another menu will be shown that includes 'New Project'. Clicking this requests the name of your project. You can then add the maps relating to this project as shown below.
Opening and Importing maps
PRSM can read files in its native format (files with the suffix '.prsm'), and files generated by other software in the following formats
- GRAPHML (.graphml),
- GEXF(.gexf),
- GML (.gml),
- GraphVix (.gv or .dot),
- Microsoft Excel (.xlsx)
- JGraph's draw.io (.drawio) -- experimental
- Kumu (.json export format) -- experimental
Not all features of these formats are supported, only those that match with the capabilities of PRSM. For instance, objects that are images or that have no labels are ignored rather than imported as Factors. Links that do not have connected source or target Factors are also ignored when importing. If you have problems importing a map, you may email prsm@prsm.uk with a copy of the file you are trying to import and an explanation of the problem.
Excel files need to be formatted in a special way - see below.
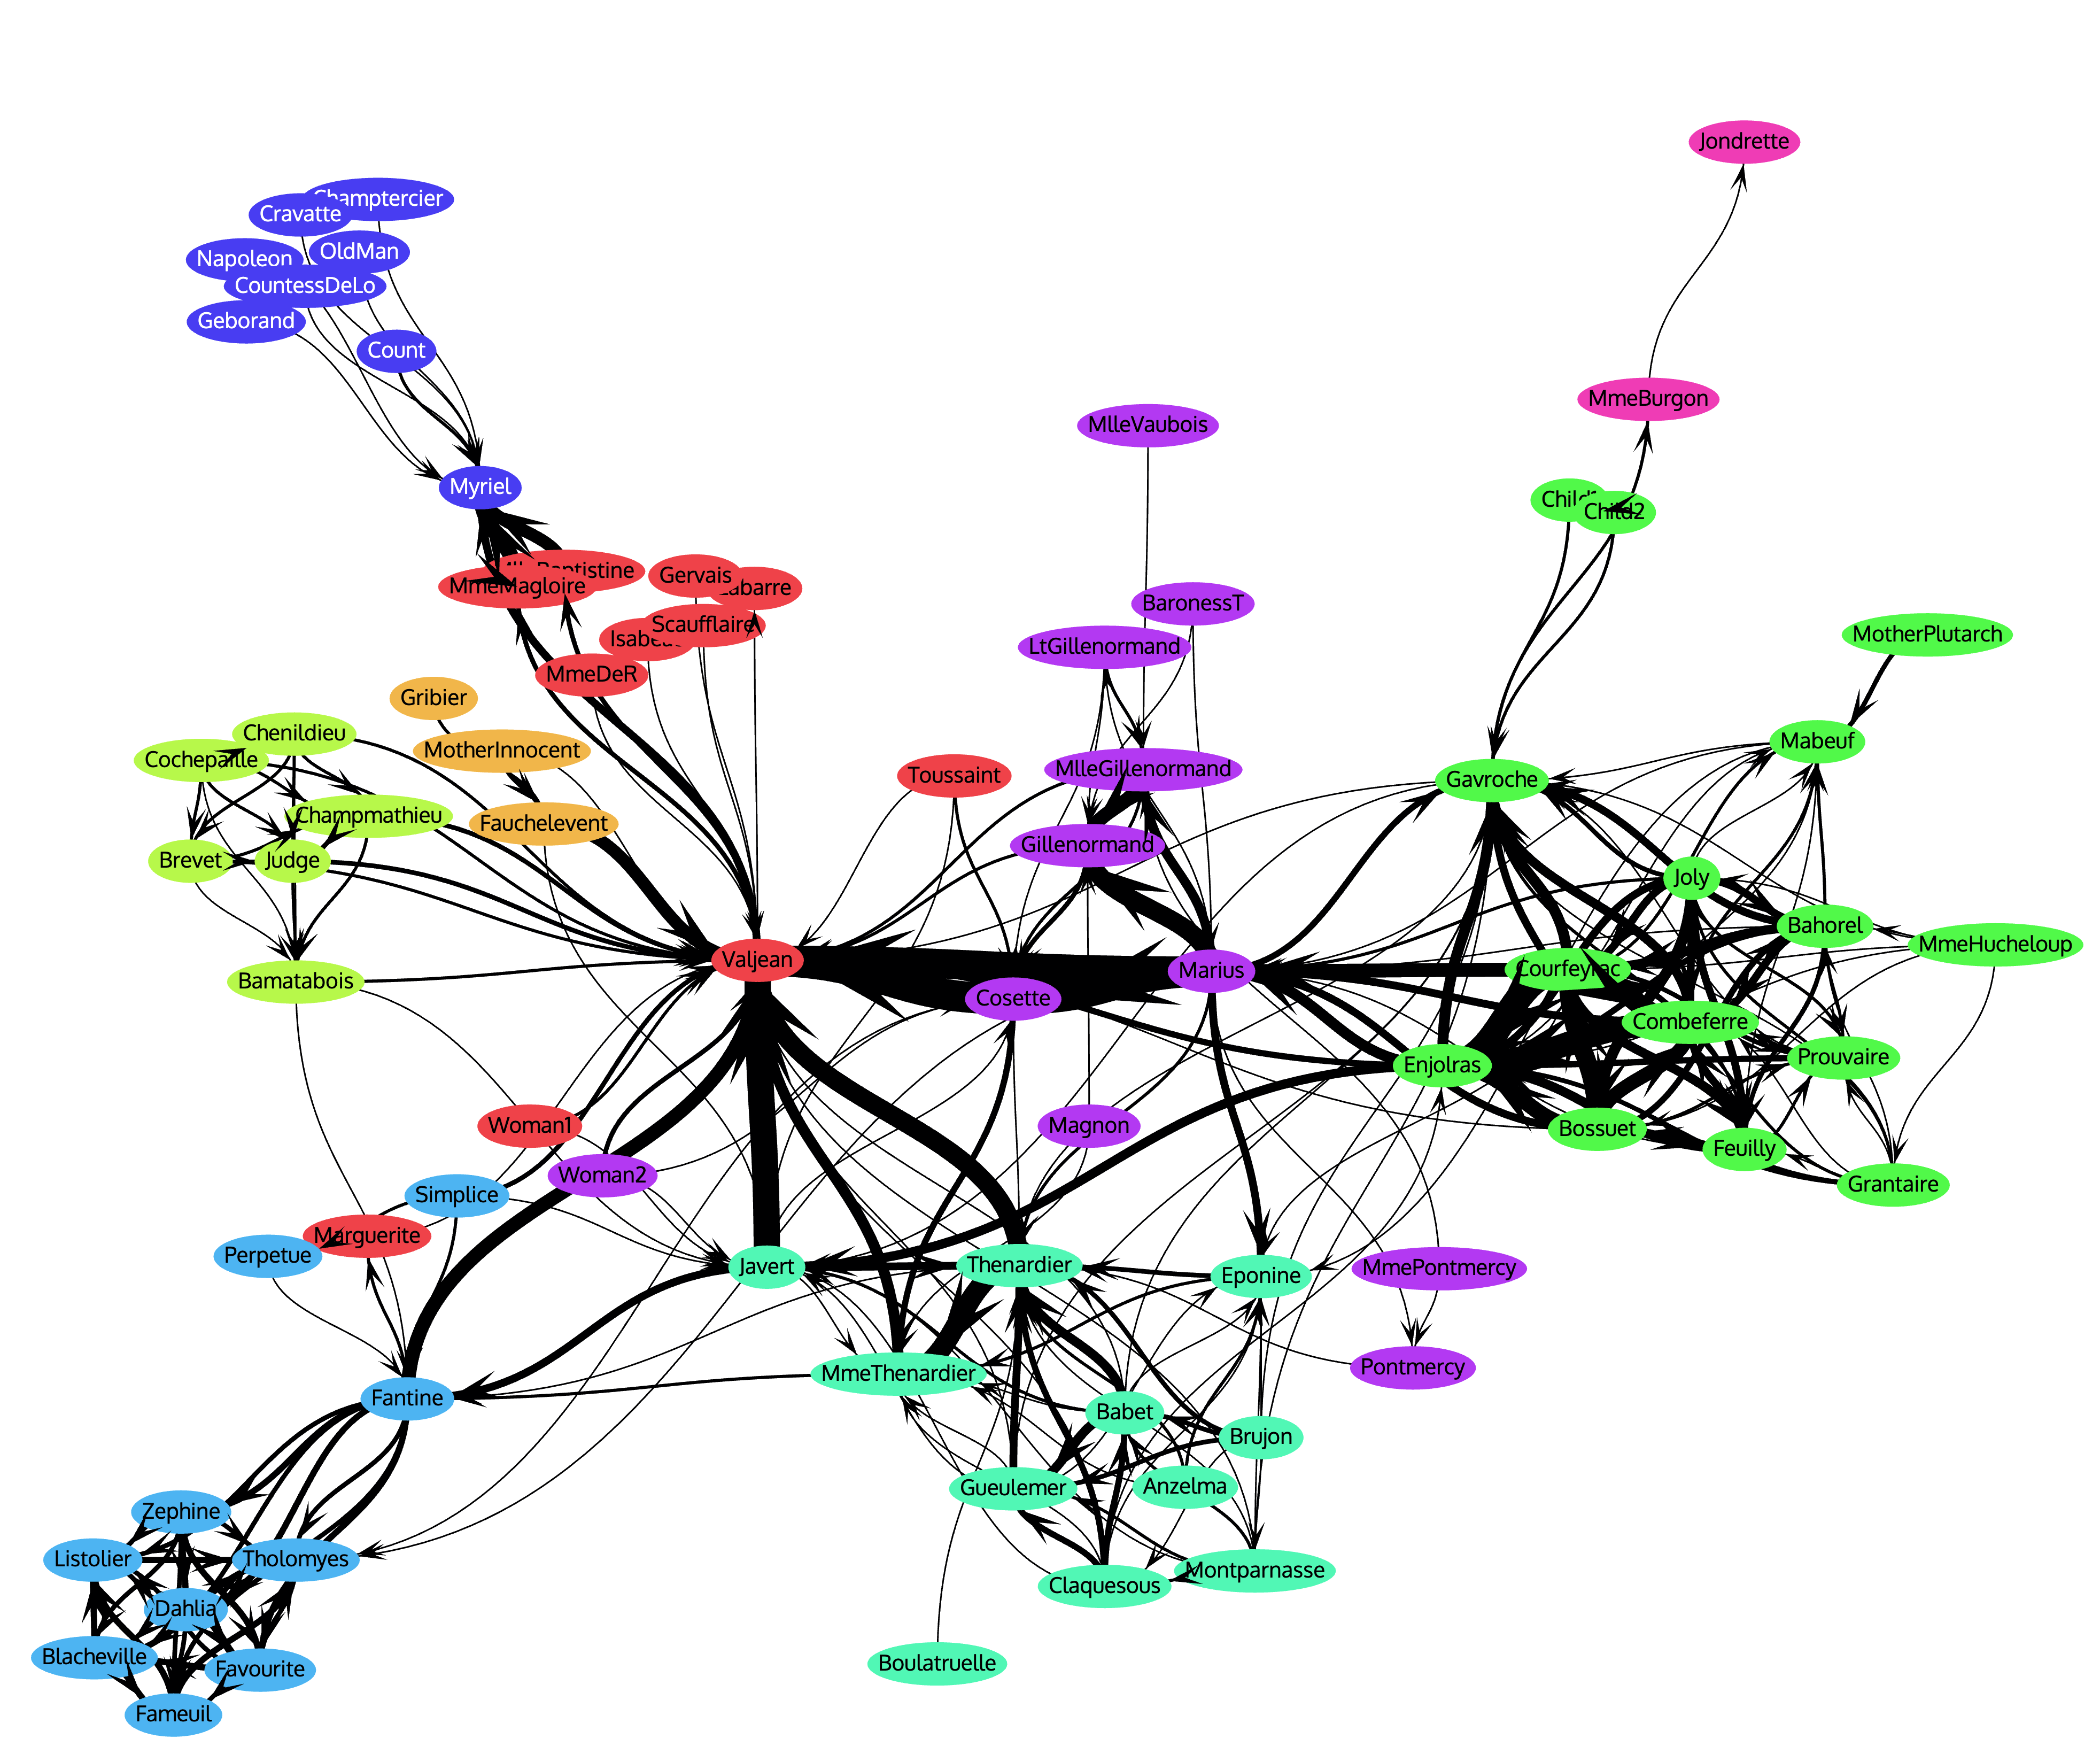
For example, the map below is the result of importing a GEXF file generated from one of the Gephi sample networks - the relationships between the characters in 'Les Miserables'.
To read in files any of these format, either use the Open button  in the top bar, or drop the file on a PRSM map window. PRSM will work out from the file extension which type of file it is reading.
On the right of the Open button is a small downward pointing triangle. If you click this, you can choose whether the map to be opened will entirely replace the existing map (the default) or be merged with the current map. For more on merging, see Merging Maps.
If you open a map to replace the current map, and then after the new map has loaded, change your mind, you can revert to the previous map by clicking the Rollback icon next to the log entry in the History panel.
However, as a special case, if you replace your map with an empty one (a map with no Factors), there is no Rollback icon in the History panel and the previous map cannot be recovered. This can be useful if, for reasons of security or confidentiality, you want to permanently erase a map: just select 'New map' from the dropdown menu to the right of the map title. Be careful to save a copy to your local file storage first if you want to preserve a copy.
Excel
To allow PRSM to read data about a map from Excel, the Excel workbook should contain two spreadsheets, one named ‘Factors’ and the other named ‘Links’. Both should have a Header (i.e. first row) of column names, with the remaining rows containing data about each Factor or Link (in any order).
The Factors sheet must have a column headed ‘Label’. This column should contain text that will become the labels of the factors. It may, optionally, have:
- a column headed either 'Note' or ‘Description’. The contents of this column will become notes for the Factors (i.e. the text shown in the Notes box when you select a Factor).
- a column headed ‘Style’, with the contents being numbers between 1 and 15, representing the style to be applied to the Factor (the styles are numbered according to the Factor Styles tab, from top left to bottom right).
- columns headed 'x' and 'y', holding the numeric coordinates of the Factors in the map.
All other columns are considered to be values of Attributes assigned to Factors and visible in the Data View of the map.
The Links sheet must have a column headed ‘From’ and another headed ‘To’. The contents of these columns should be text identical to one of the Labels in the Factors sheet. It may also, optionally, have:
- a column headed ‘Label’, with text of a label to be applied to the link
- a column headed either 'Note' or ‘Description’. The contents of this column will become notes for the Links (i.e. the text shown in the Notes box when you select a Link).
- a column headed ‘Style’, with the contents being numbers between 1 and 9, representing the link style to be applied to the Link (the styles are numbered according to the Link Styles tab, from top left to bottom right).
Saving and Exporting maps
To save the map in PRSM's own format that can be easily opened in another copy of the app, click on the Save button at the top of the window.
To save an output file in another format, click on the small downward pointing triangle beside the Save button and choose which format you want.
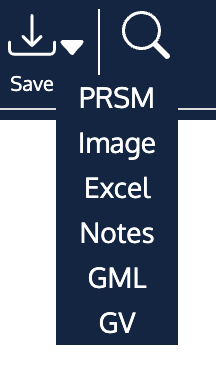
The map can be saved in the app's own native format, or as a GRAPHML, GEXF, GML or GraphVix file, or as an Excel workbook. The Notes can be written into a file readable by Microsoft Word. PRSM can also output the map as a high resolution image. In more detail:
Image file
You can save a high resolution (8192 x 8192 pixels) image of the map as a Portable Network Graphics (.png) file. If no factors or links are selected, the image will show the whole map. Here is an example of an image of a large map.
If, however, you want the image to include just a portion of the map, select a factor or factors that you want the image to be centred on. The image will include those factors and the neighbouring ones. The example below was created after selecting the factors 'Traffic noise' and 'Socio-demographic Mobility Equity' from the map above.
Unless you change the background colour, the image will have a solid white background. If you would prefer a transparent background (so that, for example, you can paste the image into a presentation and still see the slide background), go to the Background colour well in the Network tab of the Settings dialog and move the lower slider to the left, to maximum transparency.
Notes file
The output is a Word file (.docx) containing, in order, the name of the map, the contents of the map description, any Notes attached to Factors and any Notes attached to Links. The file will be formatted as far as possible similarly to the text in the app (e.g. it will retain bold and italic and bullets, and inserted images).
Exporting the map to other software
To transfer a map into other software, such as Gephi, export the map data into a file (use the GEXF format for Gephi). The fle can then be read into the other software (using its Import or Open command) and analysed as a network.